The terminology is wrong: the polynomial curve fit is still linear regression. The "linear" in "linear regression" does not mean that the resulting function is linear, it means that the resulting function is a linear combination of basis functions. For a polynomial, the basis functions are 1, x, x^2, ..., x^n.
You have to be careful here. If you transform your data, and then do a linear regression on the transformed data, and then un-transform your regression line, that's not the same as doing non-linear regression. Linear regression makes the assumption that the data is a line + normally distributed errors with 0 mean and constant variance.
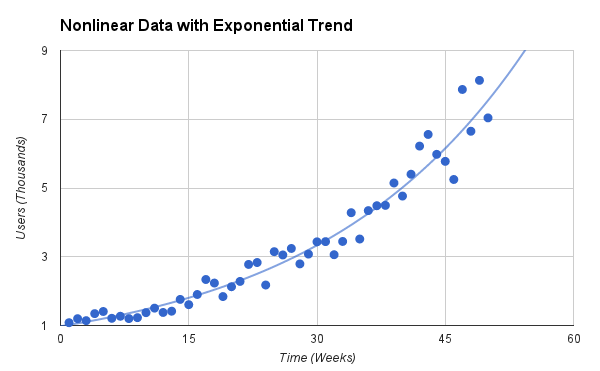
For example lets take regression for an exponential relationship. If you transform your data with log, and then do linear regression you are assuming that your transformed data fits a line with normally distributed errors with 0 mean and constant variance. This means that you are assuming that your original data fits an exponential + normally distributed errors with 0 mean and exponentially increasing variance. This might be a good assumption, but it might not be. It depends on what your data is. If you look at his data [1] you see that the variance is increasing, so that indicates that his method is OK for that data.
What is going to happen with his method is that points far away from 0 are going to weigh far less into your regression than points near 0. It's not the same as doing a non-linear regression, which would assume that your data fits an exponential + normally distributed errors and constant variance. That would give all points equal weight.
Oh dear! He does not even discuss the HUGE errors that may appear when taking logarithms... If you have points near 0 and away from 0 the former get an artificial enormous weight and bias the "interpolation" too much towards them.
CAREFUL!
Basically: the mean value of the logarithms is not the logarithm of the mean value.
Logistic regression is similar to his example on fitting a line to an exponential trend. The differences is that in logistic regression, the equation would be
ln(p)/ln(1 - p) = α + Σßᵢxᵢ
where p is in the interval [0, 1] and E is .
Note: in logistic regression, the notation is generally p (as in probability of event), not y.
The exponential fit, however, is non-linear.
From Wikipedia (http://en.wikipedia.org/wiki/Polynomial_regression)
> In statistics, polynomial regression is a form of linear regression...